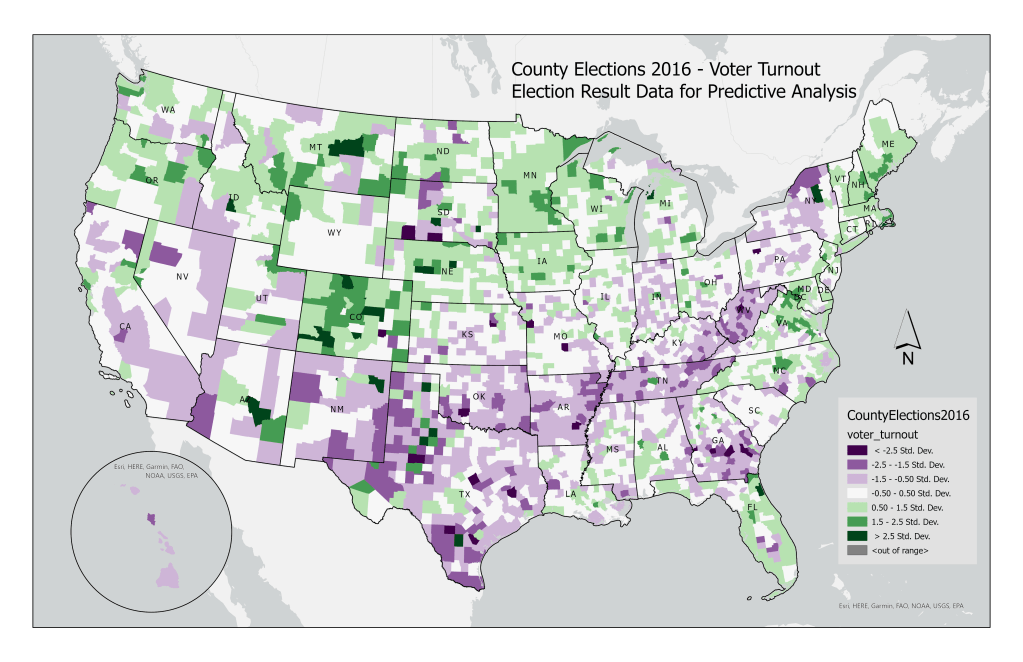
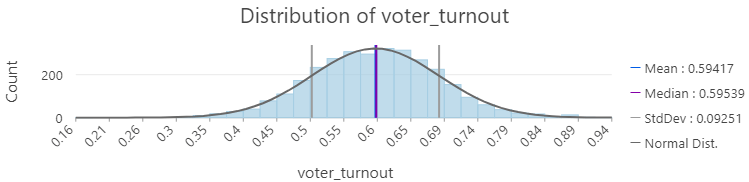
Modeling level of voter participation to understand where low turnout is prevalent. Nearly symmetrical bell shape with fairly identical mean and median values indicates that the voter_turnout variable is normally distributed; values fall near the average in the center of the distribution, with decreasing values as you move farther towards the left and right tails.
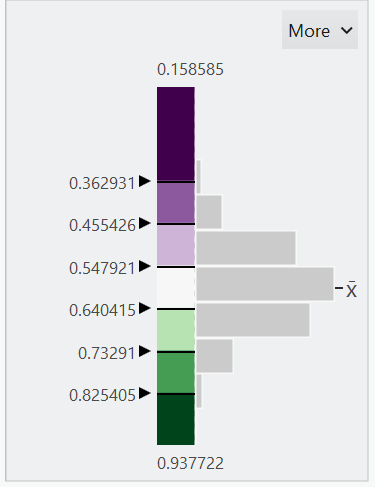
The Standard Deviation method was used to classify voter_turnout, as it is normally distributed; below-average voter turnout counties are represented in shades of purple, and above-average in shades of green.
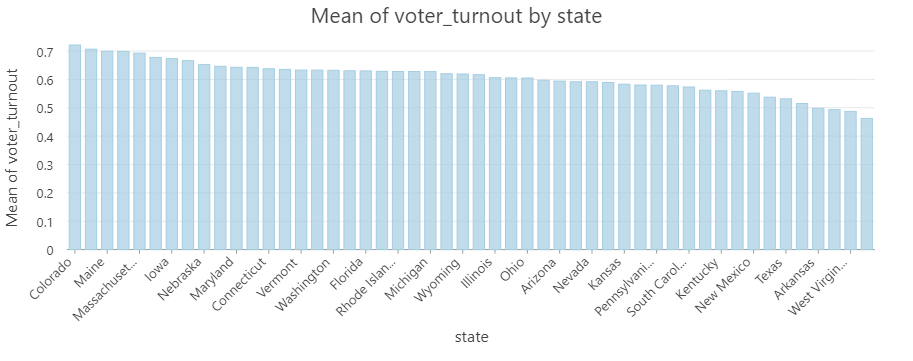
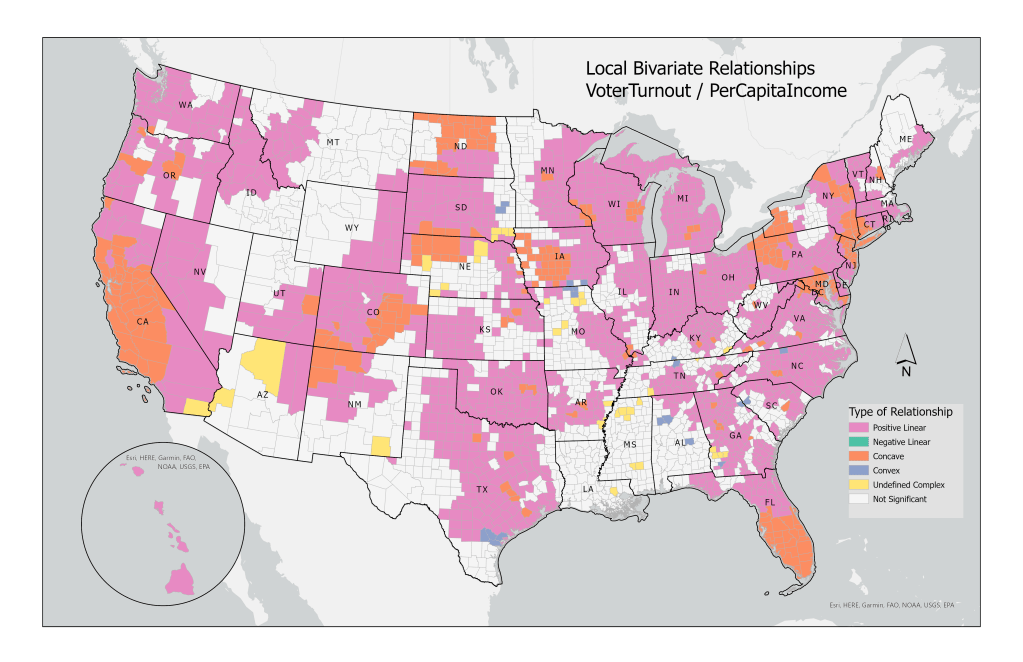
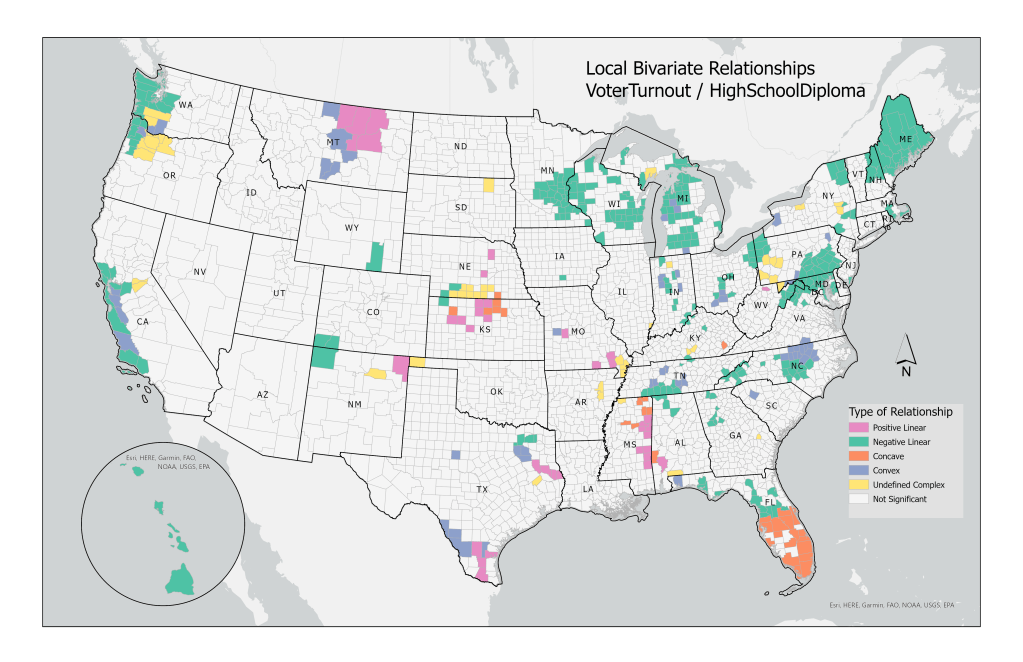
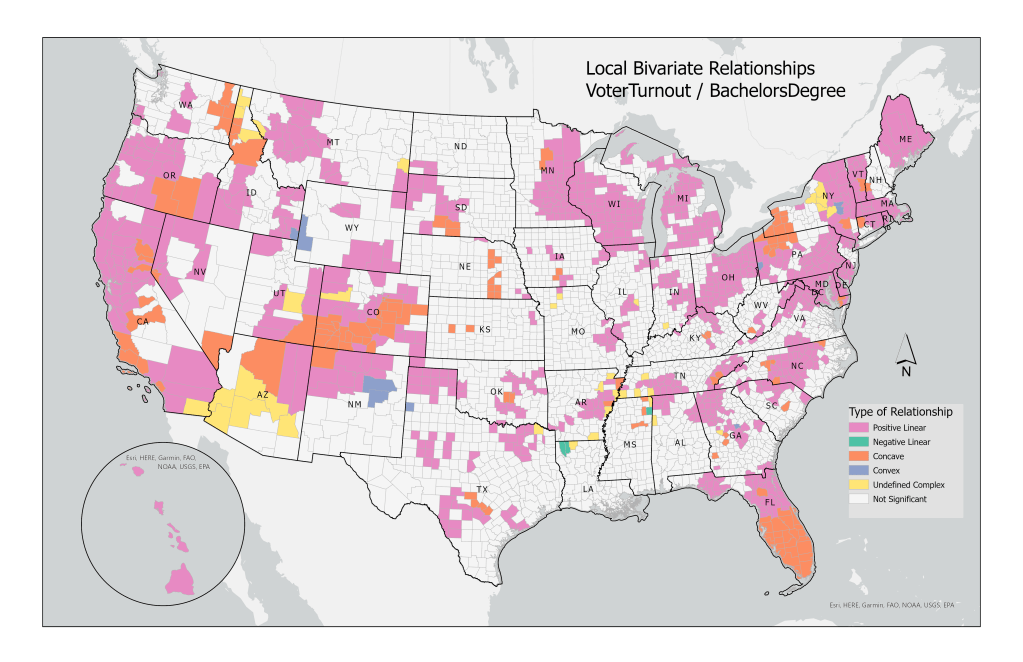
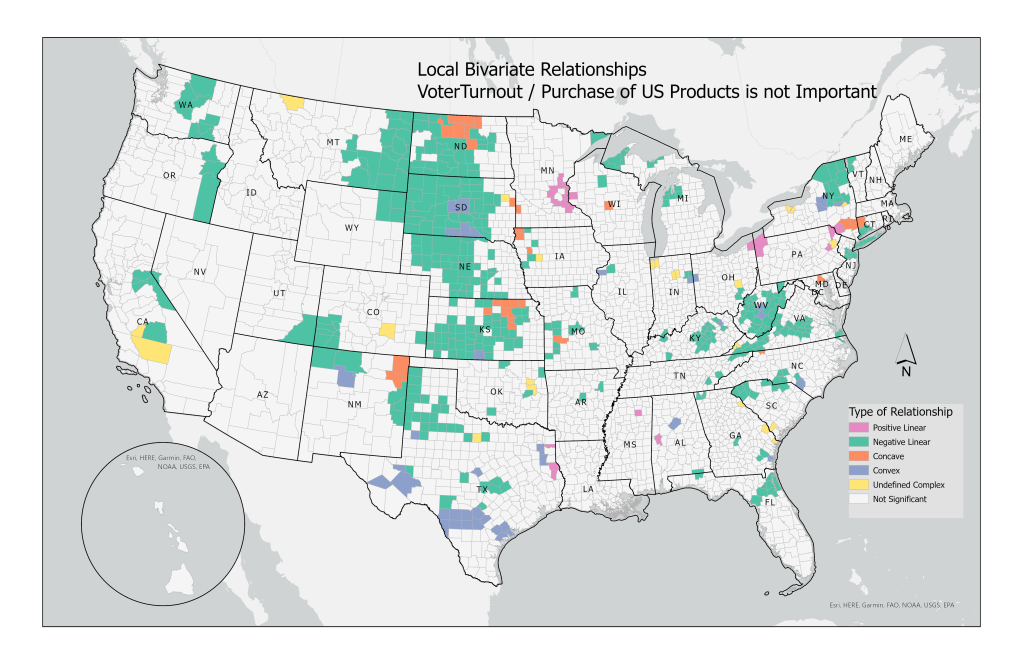
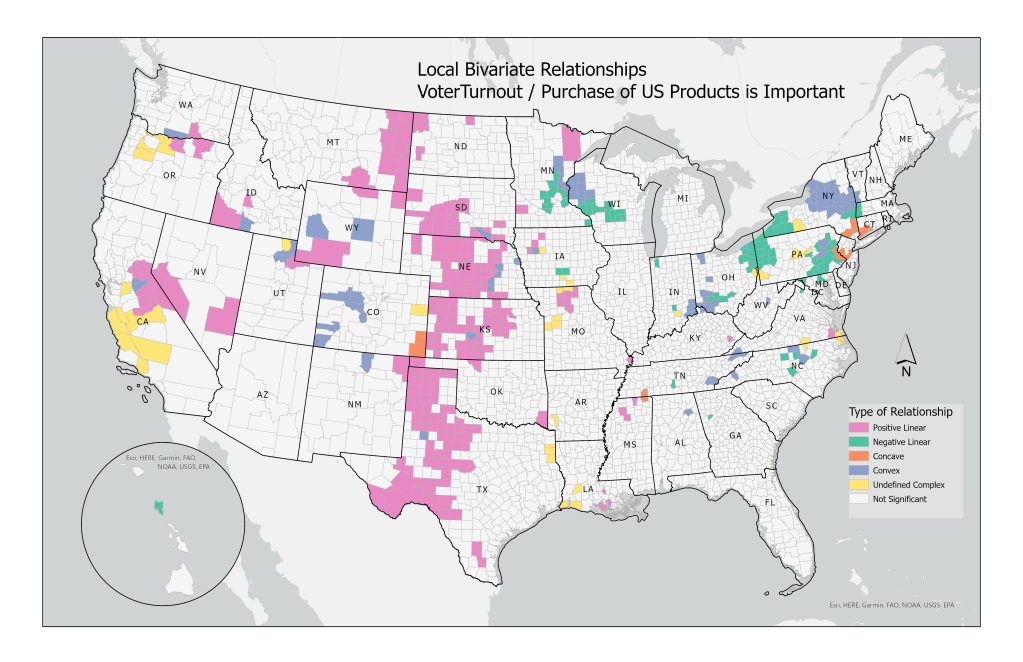
Hawaii (farthest bar to the right), West Virginia, and Tennessee have the lowest average voter turnout. The Local Bivariate Relationships tool identifies linear, concave/convex, as well as other complex relationships; colors correspond to the type of relationship found in that area.