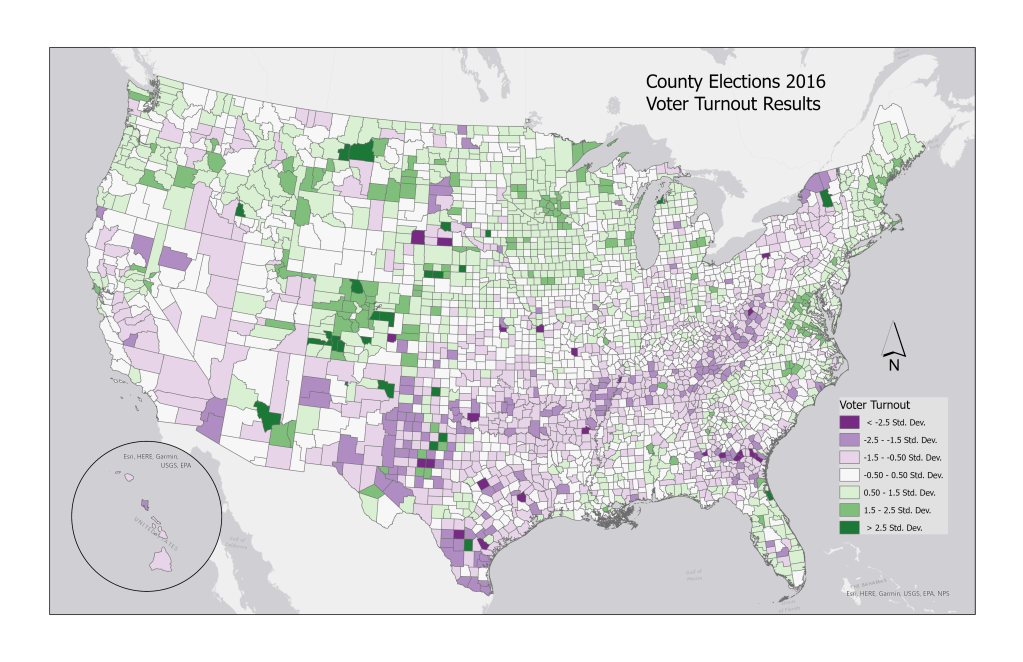
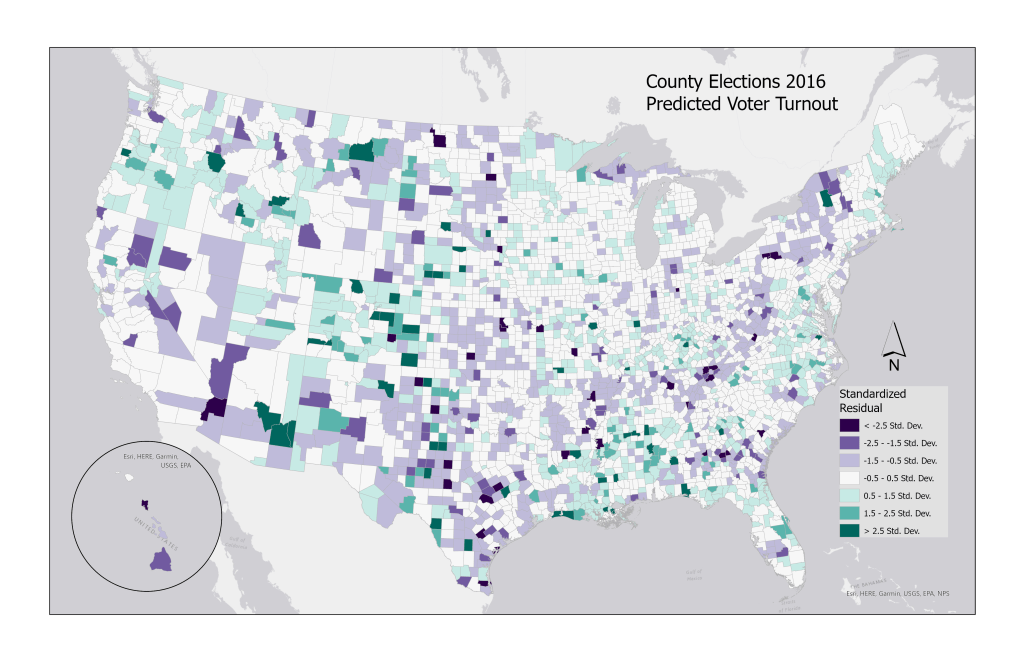
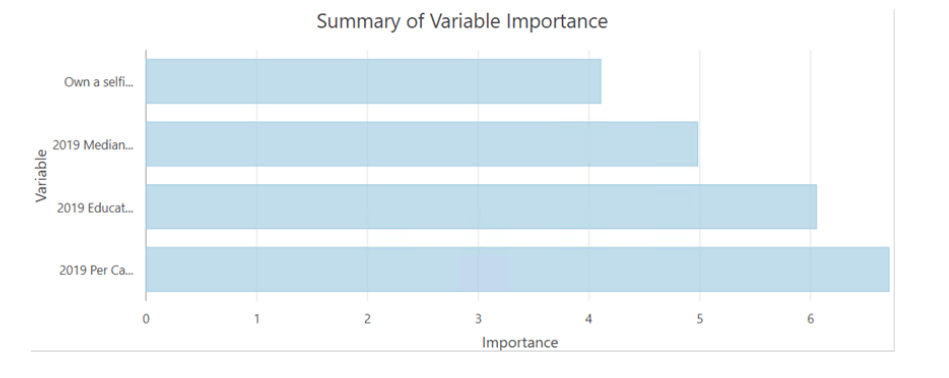
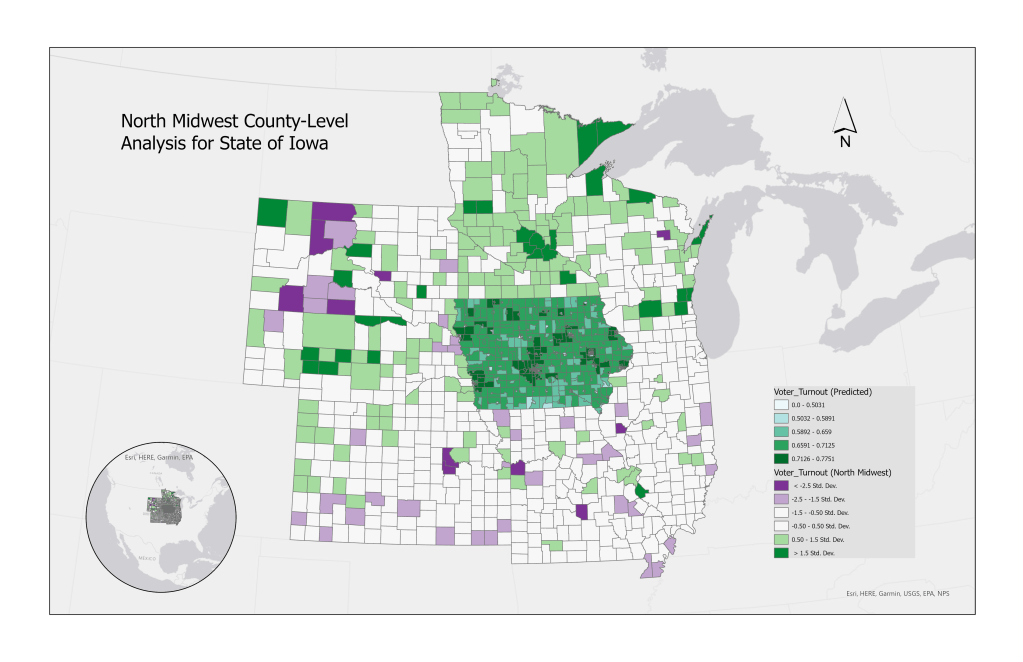
Voter turnout value below the mean are in shades of purple, and value above the mean are in shades of green.Displays predicted voter turnout for each county.‘2019 Per Capita Income’ and ‘2019 Education: High School/No Diploma’ variables are the most useful in predicting voter turnout.
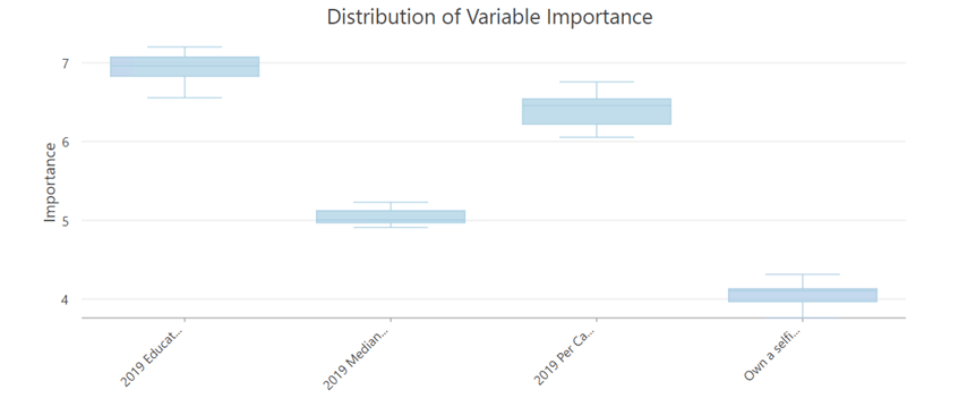
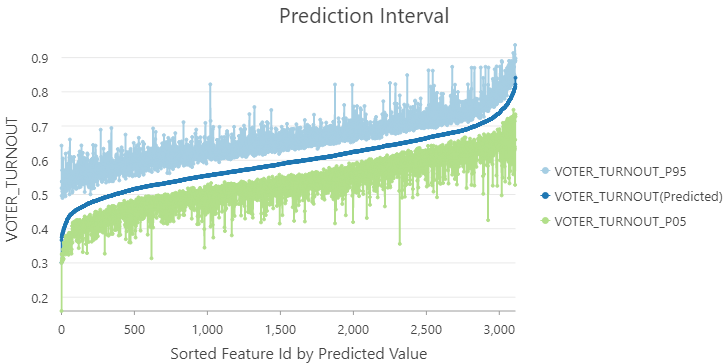
Prediction intervals in the model are consistent; performance relatively stable across all values.
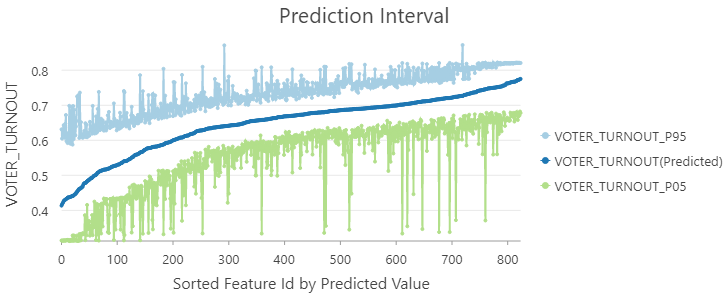
Confidence intervals are smaller for low voter turnout values, indicating stable model.